
Theme
Interface and Tool Organization
A comprehensive walkthrough of Jupiter's user interface, tool regions, canvas gestures, and analysis views.
Home Screen
When opening http://localhost:5173, you will see the project management dashboard listing all your models as project cards.
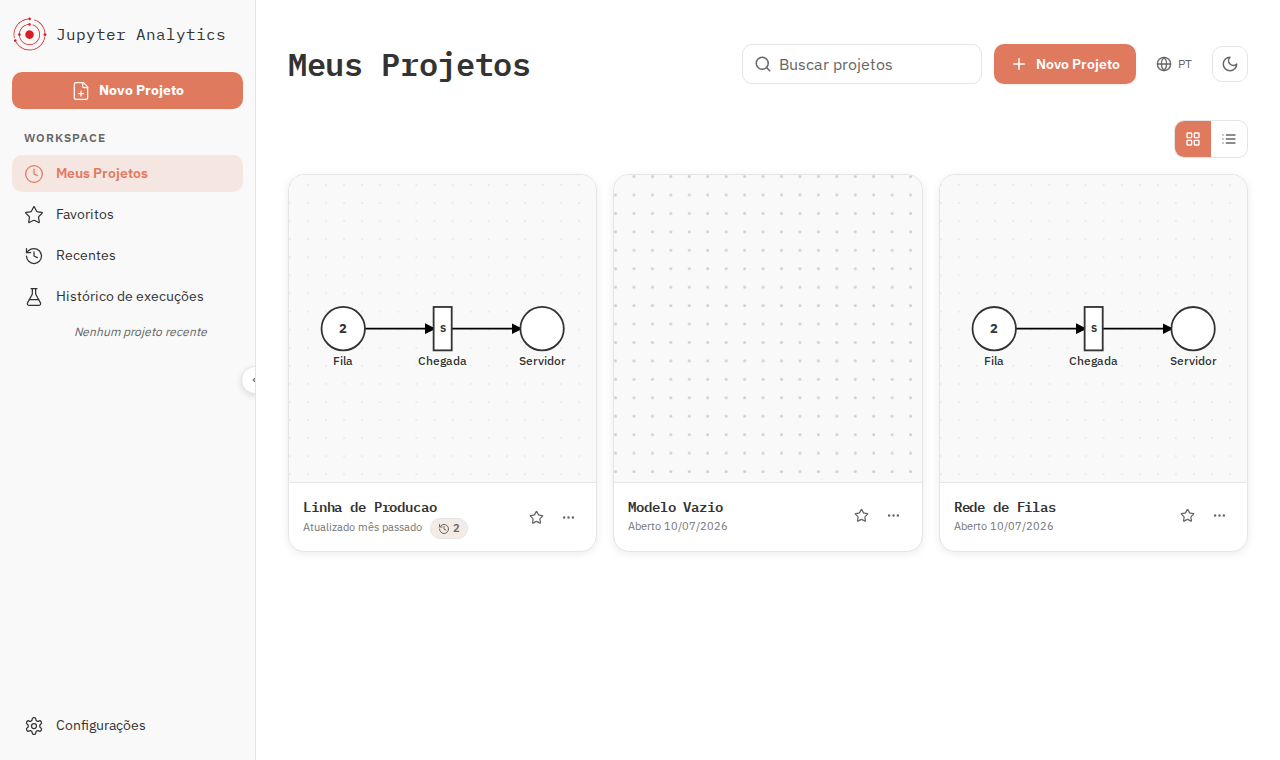
- New Project: Creates an empty model and opens the editor immediately.
- Left Sidebar: Shortcuts to My Projects, Favorites, Recent, Execution History, and Settings (theme and language switcher).
- Click any project card to open it in the editor.
The Model Editor
The editor is where you spend most of your time: constructing the net, configuring parameters and metrics, and running simulations.
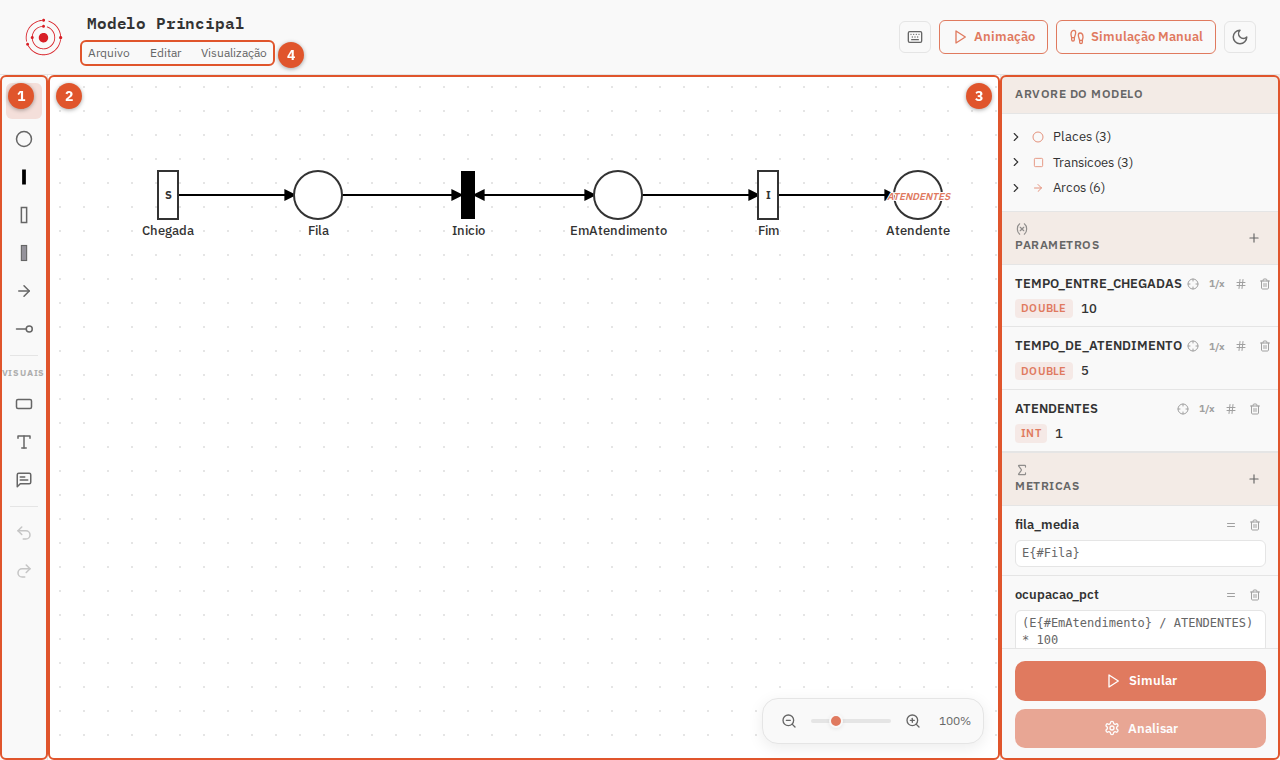
1 · Toolbar (Left)
Selects what clicking the canvas does:
- Select: Move and box-select elements.
- Place: Adds places (circles) to hold tokens.
- Transitions:
- Immediate: Solid rectangle, fires in zero time.
- Exponential: Outlined rectangle with exponential delay.
- Deterministic: Outlined rectangle with fixed constant delay.
- Arc: Directed connection for consuming and producing tokens.
- Inhibitor Arc: Line terminating with a circle that prevents firing while tokens exist.
- Visuals: Rectangles, text boxes, and sticky notes for annotating the diagram (ignored by the calculation engine).
- Undo / Redo: Revision history controls.
Hovering over any tool displays its name and keyboard shortcut.
2 · Modeling Canvas (Center)
The infinite vector canvas where you build your Petri net:
| Action | Touchpad | Mouse |
|---|---|---|
| Pan canvas | Two-finger drag | Middle-click drag or Shift + wheel |
| Zoom | Pinch gesture | Ctrl + mouse wheel |
| Reset zoom and center (100%) | Ctrl+0 | Ctrl+0 |
The zoom control in the bottom-right corner also provides manual scale controls.
3 · Model Inspector Panel (Right)
Displays metadata, global properties, and the selected element's settings:
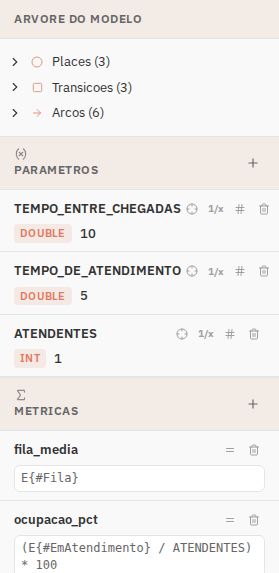
- Model Tree: Count and hierarchy of places, transitions, and arcs.
- Time Unit: Global time unit of the model (
ms,s,min,h,d). - Parameters: Constants and derived variables with controls to add (
+), highlight usage, edit, or delete. - Metrics: Formulas defining performance queries.
- Properties: When an element is selected, this panel displays its specific attributes (name, initial marking, delay, distribution, priority, weight, etc.).
- Simulate & Analyze: Buttons at the bottom to configure and run simulations or view graphs.
4 · Top Menus
- File:
- Save / Auto-save: Keeps changes in sync automatically.
- Import (Local): Loads a model
.jsonfile. - Export (Local): Saves the current model as
.jsonfor Git versioning or sharing. - Export PNG / Export PDF: Exports vector/raster image of the diagram for research papers or reports.
- Edit: Standard copy, paste, duplicate, and deletion actions.
- View: Snap-to-grid, alignment helpers, and visual annotations toggle (
Ctrl+Shift+V).
Canvas Layers
Visual grouping rectangles, notes, and labels help organize large architectures without impacting calculations (the engine ignores annotations completely):
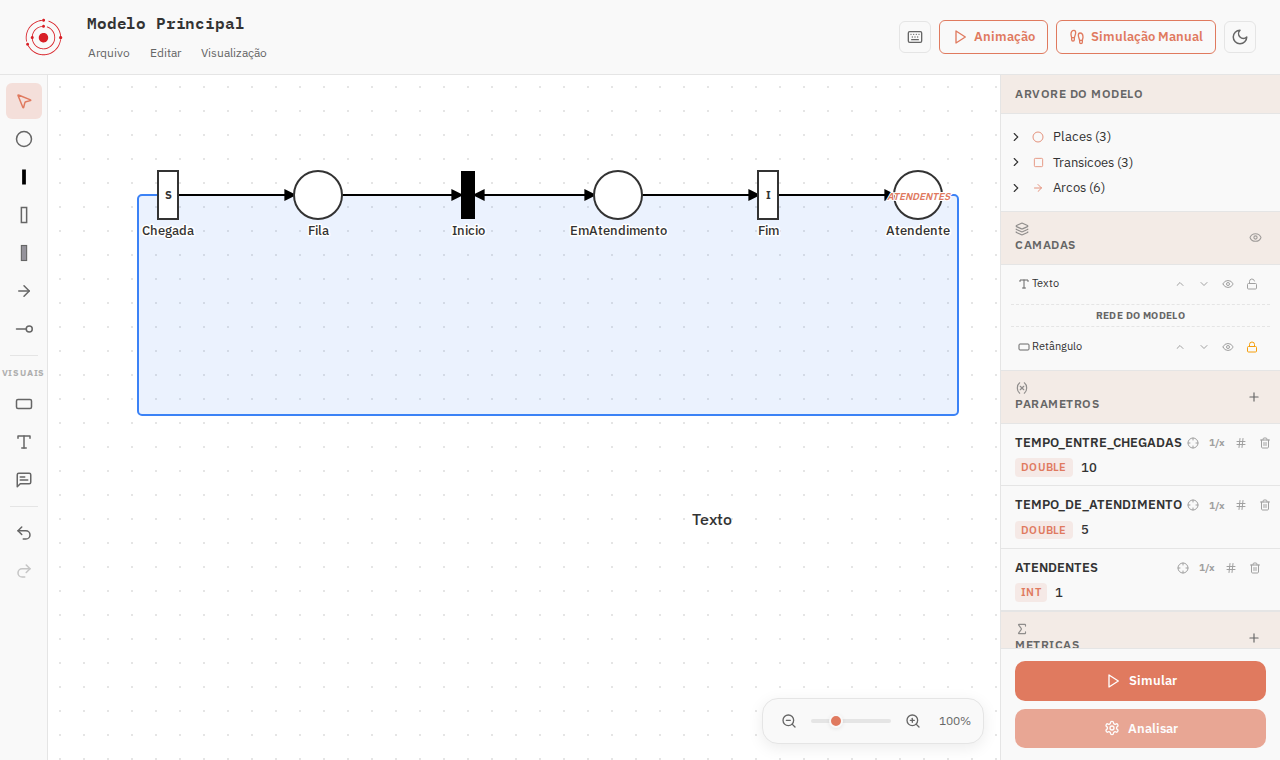
- Items above
Model Netrender over nodes (foreground callouts and titles). - Items below render behind nodes (background bounding boxes).
- Eye icon: Toggles element visibility.
- Lock icon: Prevents selection so you can draw and select nodes over background boxes without moving them by accident.
- Keyboard shortcuts Ctrl+] and Ctrl+[ move items up and down the stack.
Analysis Screen
Accessed via the Analyze button or automatically upon simulation completion:
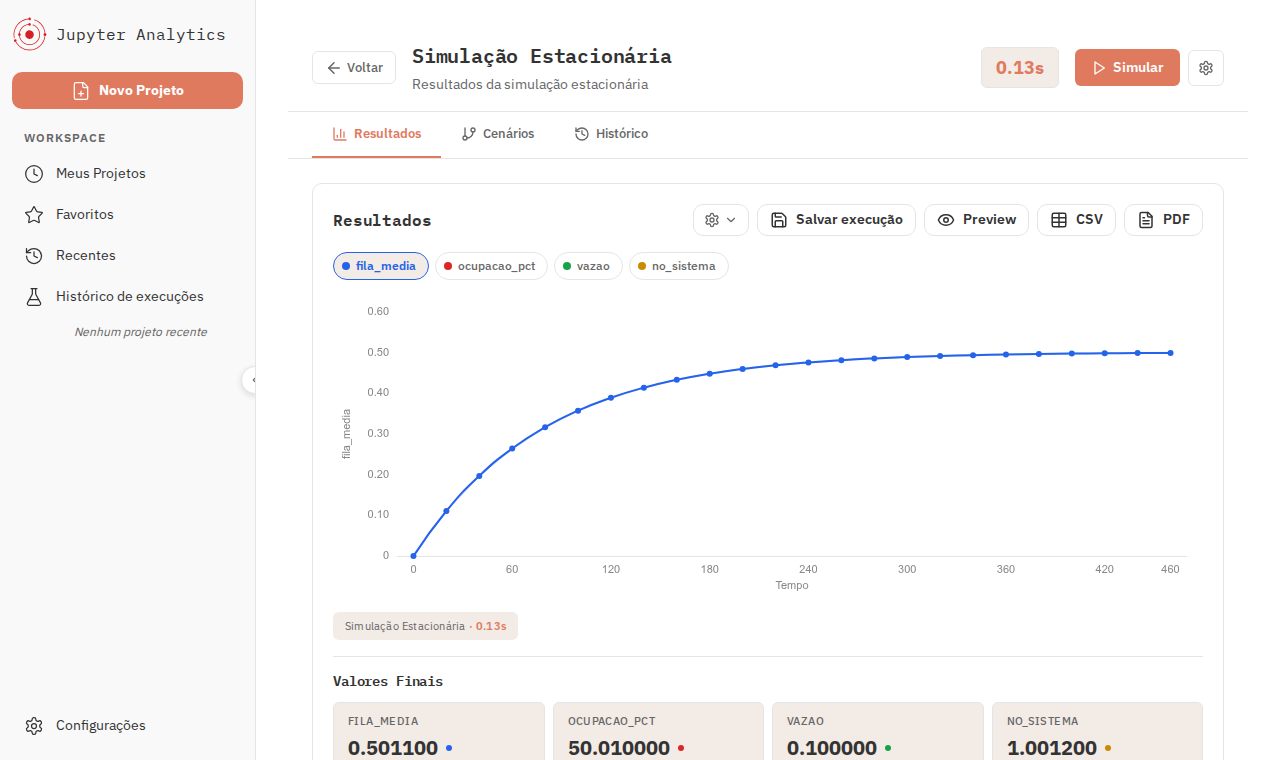
- Results: Final estimates for each metric with statistical margins of error, convergence charts, and validation warnings.
- Scenarios: Automated parametric studies sweeping variables over continuous ranges.
- History: Archive of past runs with saved models and configurations.
Quick Reference Table
| If you want to... | Go to |
|---|---|
| Create a new model | Home screen → New Project |
| Open an existing JSON model | Editor → Menu File → Import (Local) |
| Add a place or transition | Left toolbar |
| Edit parameters and metrics | Right panel |
| Choose global time unit | Top of the right panel |
| Run a simulation | Click Simulate at the bottom of the right panel |
| View plots and tables | Click Analyze at the bottom of the right panel |
| Compare scenarios over a range | Analysis screen → Scenarios tab |
| Export model definition as JSON | Editor → Menu File → Export (Local) |
| Export publication diagram | Editor → Menu File → Export PDF / PNG |
Next steps
Learn how to build Petri nets in 2 · Model Building.