
Theme
Interpreting Results
Upon completion of a run, the Results tab presents the simulation estimates across three sections: the metrics table, the convergence/time series chart, and model verification warnings.
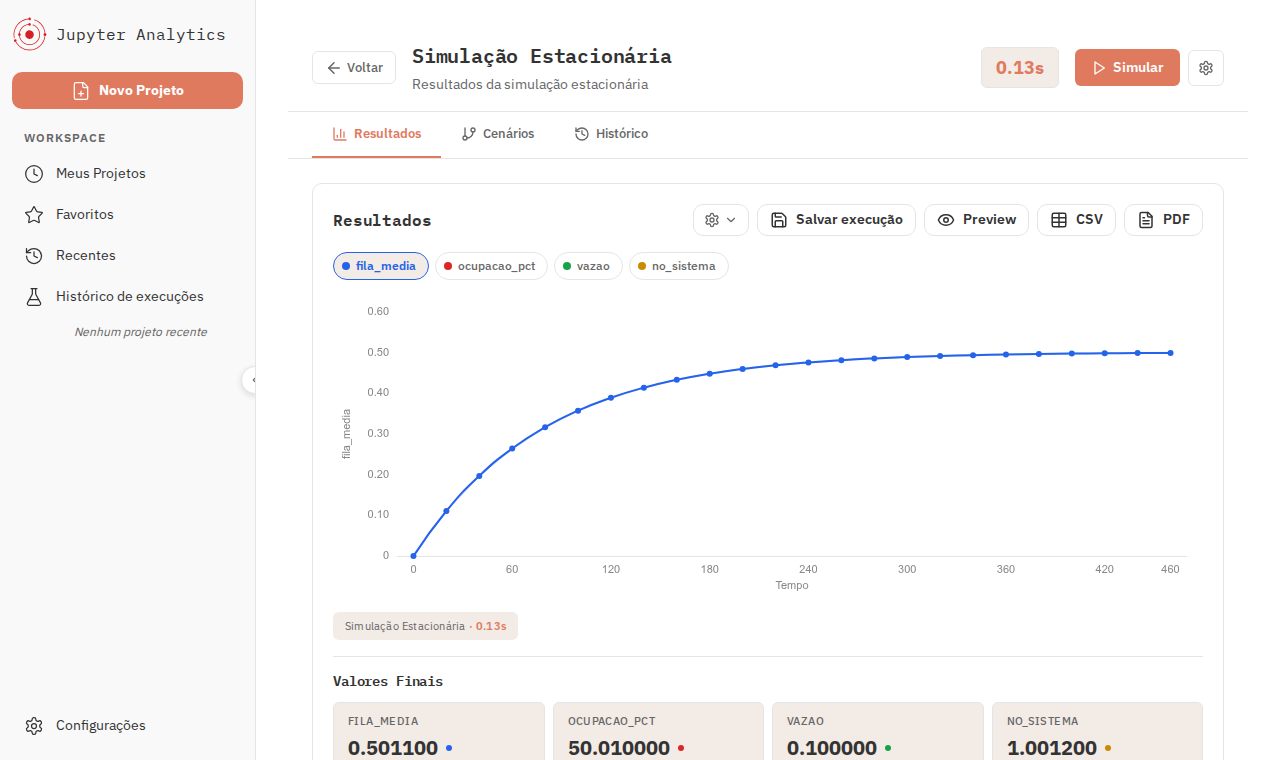
Metrics Table and Error Margins
The table lists every declared metric alongside its estimated point value and statistical margin of error:
$$\text{Estimated Value} \pm \text{Margin}$$
For example, a result of 0.50 ± 0.01 (at a 95% confidence level) means there is a 95% statistical probability that the true theoretical system mean lies between 0.49 and 0.51.
Margins of error are integral to the result
A point estimate without an error margin lacks scientific validity. An output like 0.50 ± 0.35 indicates that the simulation was too brief and statistics have not yet converged.
This is especially vital when comparing alternatives: if configuration A yields 0.50 ± 0.10 and configuration B yields 0.55 ± 0.10, you cannot claim configuration A is superior, as their confidence intervals overlap. Increase simulation time to narrow margins before deciding.
Charts
- In Stationary Mode: Displays comparative bar charts between metrics or convergence curves.
- In Transient Mode: Displays time series curves showing how metrics evolve over time. Colored buttons above the chart toggle between metric series instantly.
Model Verification Warnings
Jupiter inspects model structure to catch subtle modeling pitfalls. These warnings do not halt execution, but alert you that the results may not mean what you expect:
| Warning | Likely Cause | Recommended Action |
|---|---|---|
| Capacity without effect | A timed transition is set to Single Server (S) but consumes from a place with multiple tokens. | Change policy to Infinite Server (I) if resources operate concurrently. |
| Time written as 1/parameter | A delay field uses 1/PARAM, indicating the parameter was treated as a rate. | Store delays directly in the parameter and toggle Consider as rate in Scenarios. |
| Transient unstable metric | A metric divides by a short-lived place during transient simulation. | Rewrite the metric multiplying by arrival delay as shown in Response Time. |
| Missing warm-up period | Cold-start startup states were included in stationary averages. | Set a warm-up period of 5% to 10% of total horizon. |
| Unused parameter | A parameter was declared but is not referenced in any node or formula. | Check for typos in place, transition, or metric fields. |
Five-Step Sanity Checklist
Before publishing results or making sizing decisions, run through these checks:
- Are confidence margins sufficiently narrow? If the margin exceeds 5% of the estimated value, increase the simulation time.
- Does flow conservation hold? Total arrivals must equal completed departures plus dropped items.
- Are orders of magnitude plausible? Sub-millisecond response times in a model where tasks take minutes point to unit confusion or rate/delay inversion.
- Does the result double when doubling simulation time? If doubling run time doubles the queue length, the system is saturated (arrival rate exceeds capacity) and will never reach finite equilibrium.
- Did any verification warnings appear? Review all notifications before adopting the numbers.
Next steps
Learn how to sweep parameters and generate comparative curves in Comparing Scenarios.